
The truth about who actually supports and opposes Obama’s handling of immigration
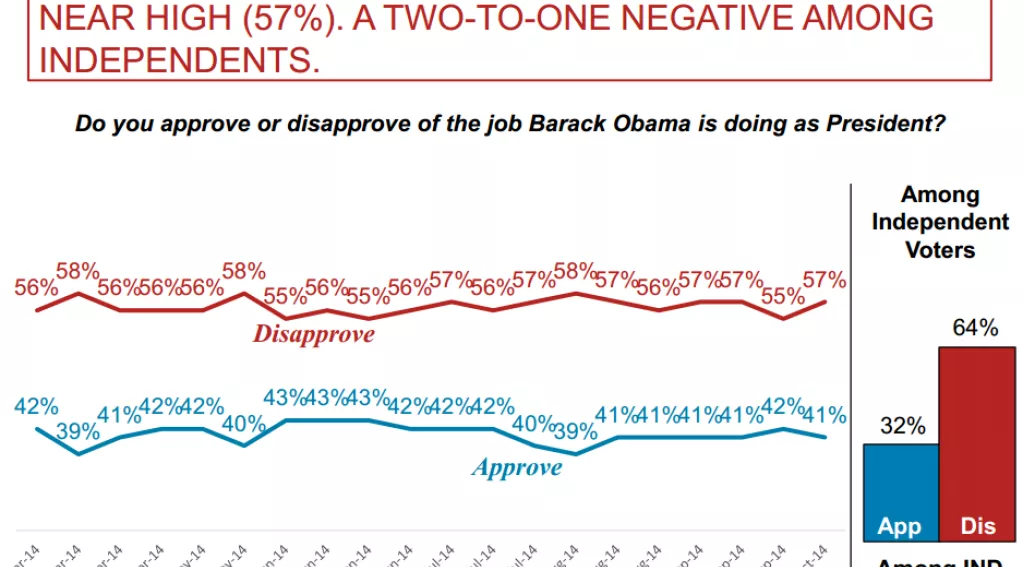

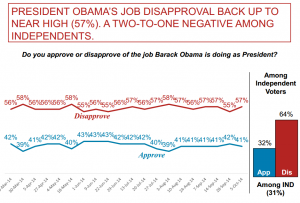 When someone uses the term “immigration reform advocate,” the mental image of a Hispanic Millennial may be the first to come to mind.Contrastingly, at the mention of “securing the border,” one may think of a middle-aged suburban and rural dweller.New data from a Paragon Insights poll indicated that both of those perceptions are partially incorrect. The early October survey looked into how Americans feel about President Obama’s handling of immigration. Surveyors then broke down their findings into geographical, sociological and political categories to provide a more thorough analysis of how important true immigration reform is among these different groupings.Fifty-eight percent of likely voters disapproved of how Barack Obama has handled the issue of immigration. Only 32 percent of the country approved of his approach while 9 percent stated “don’t know/no opinion.” The below categorizations were all in response to whether they do or not approve of Obama’s management of national immigration policies.
- More voters from ages 30 to 44 approved (41 percent) than those from 18 to 29 years of age (36 percent).
- African Americans were the most approving of the president (64 percent), higher than Hispanics (57 percent)
- The Pacific region of the country had the highest approval rate of the president’s handling of immigration, weighing in at 42 percent. The West North Central had the lowest rate of approval (21 percent) while the Midwest weighed in with 26 percent.
- Regional disapproval rates were much higher, ranging from 50 to 73 percent. The Pacific registered the lowest rate of disapproval (50 percent) while again the West North Central region expressed the most disapproval (73 percent).
- 42 percent of respondents with a post-graduate degree approved while only 28 percent of those with less than a college degree agreed.
- Urban dwellers were most in support while residents of rural areas were most opposed.
- Democratic men were easily the most supportive demographic group, with 63 percent approving of Obama’s management of immigration. Republican men voiced the most disapproval (84 percent).
- The most ironic finding came near the end of Question #64, where those who said jobs were the most important issue, showed the second highest approval rate (42 percent). Eighty-four percent of those who viewed the deficit/debt as the most important issue disapproved of the president’s handling of immigration.
< Previous Article
Temporary? Protected Status
Next Article >
Obama Orders Millions of Amnesty Cards. But Why Stop There?